


AMD’s 5000G Series Cezanne APUs are now available to the retail market, is the new Ryzen 5 5600G a compelling buy for system builders?

Product on Review: Ryzen 5 5600G Processor
Manufacturer: AMD
Street Price: $259 USD / $399 AUD
Back in April AMD rolled out their Ryzen 5000G APUs. Choosing to opt for partial retail supply to the OEM market. Today sees the release of the G Series into the hands of hardware enthusiasts and gamers.
The eagle eyed among you will see very few differences between Ryzen 5000 X and G Series. Indeed, the 5600G we’ll be checking out today is almost identical – 6 cores, 12 threads, 65W TDP, 24 PCIe lanes. However, the clock speeds are different. The 5600G takes the base clock up to 3900MHz from 3700MHz but the 5600X favours a higher turbo boost, from 4.4GHz to 4.6GHz – a +200MHz differential. The G Series also lacks the PCIe Gen4 support, so those 24 lanes are all 3.0.
Furnishing the Ryzen 5000 Series with APUs later into 2021 makes sense as it solidifies this generation for AMD – giving users the option have integrated graphics, even if it is Vega 7 and not RDNA.
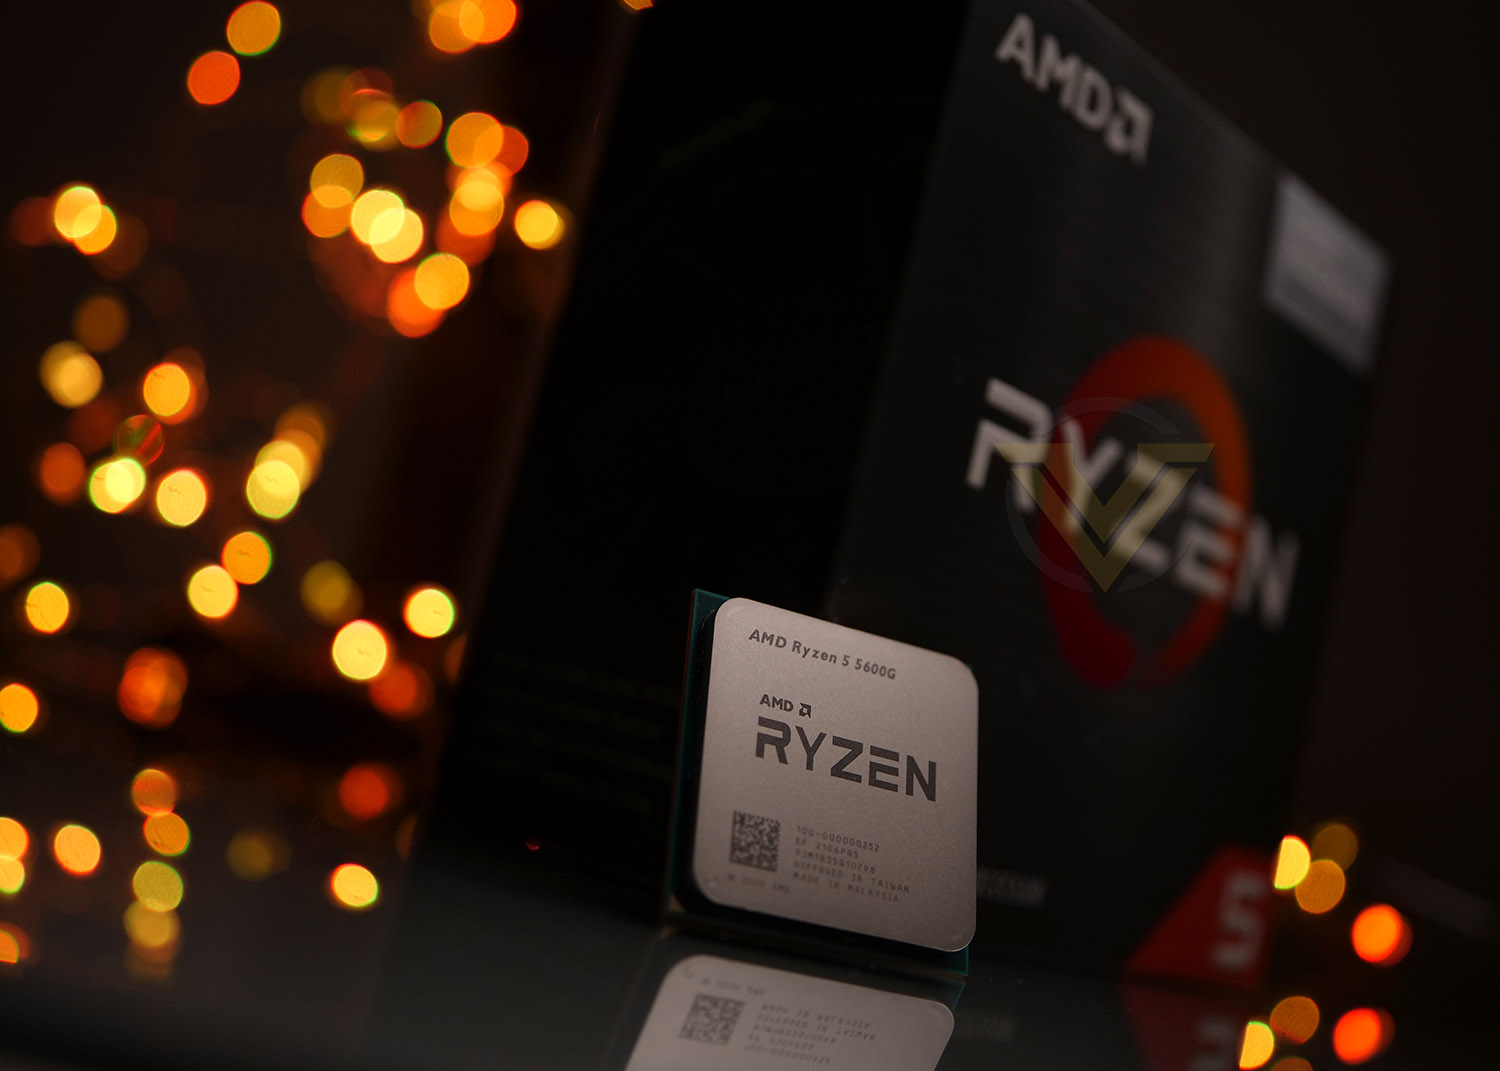
AMD on their 5000G Series
Count on a PC that’s fast, efficient, and reliable with the world’s most advanced 7nm processor core technology1 at the heart of your system. AMD Ryzen™ 5000 G-Series Desktop Processors with Radeon™ Graphics are designed with industry-leading 7nm process “Zen 3” processor technology for faster, efficient processing to get it all done, faster than ever before, while running cool and quiet.
Technical Specifications
Model No.: AMD Ryzen 5 5600G
Base Clock Speed: 3.9 GHz
Max Boost Speed: 4.4 GHz
Cores/Threads: 6/12
L2/L3 Cache: 3MB/16MB
TDP: 65W
Unlocked: Yes
PCIe Platform Lanes: up to 24
Memory Support: DDR4-3200
Graphics: Vega 7 Graphics
Base Clock Speed: 3.9 GHz
Max Boost Speed: 4.4 GHz
Cores/Threads: 6/12
L2/L3 Cache: 3MB/16MB
TDP: 65W
Unlocked: Yes
PCIe Platform Lanes: up to 24
Memory Support: DDR4-3200
Graphics: Vega 7 Graphics
SMT SUPPORT
Each AMD Ryzen 5000-series incorporates native support for Simultaneous Multi-threading. Roughly analogous to Intel’s Hyperthreading technology, SMT allows the processor to process two independent compute threads simultaneously on a single CPU core, sharing hardware resources where appropriate. Overall CPU performance therefore scales exceptionally with highly threaded tasks and operational scenarios.7nm and AM4
MANUFACTURING NODE
The Ryzen 3000-series made history as the first mainstream desktop processor to transition to TSMC’s 7nm manufacturing process, utilising the improvements it offered in terms of smaller die size and lower power requirements for CPU Core Dies (CCD) while maintaining a 12nm package for the larger IO die (on which sits the memory controller and other IO functions).Ryzen 5000-series processors are similar. The 7nm process involved is a more mature one, though AMD fall short of calling it 7nm+, so it should offer more consistent yields and binning opportunities for high performance parts. The IO die meanwhile is identical to that utilised in the ‘Matisse’ 3000-series processors, utilising the same 12nm process for the sake of consistency.
While it is common for manufacturers to increase power limits in order to squeeze new performance from each subsequent generation, AMD have instead maintained the TDP criteria from Zen 2 to Zen 3 at stock. Perf/watt improvements therefore are a direct result of performance-based architectural improvements rather than boosting power limits.
Current 500-series motherboards are compatible with Ryzen 5000-series processors when updated to an appropriate BIOS
SOCKET PARITY & MOTHERBOARD COMPATIBILITY
A large contributor to Ryzen’s success has been the continuity offered by Socket AM4 and backwards/forwards compatibility across updated motherboard generations. This outing is nonetheless likely to be the final hurrah for AM4 prior to transitioning to a new socket and DDR5 memory, and you always want to send them off by making a statement.The Ryzen 5000-series is compatible straight out of the box with 500-series motherboards on sale right now, comprising all X570, B550 and A520 models. 500-series models already in the hands of end-users require an AGESA 1.0.8.0 UEFI BIOS or newer, for which there was wide-spread release in August/September after an initial May rollout. If in doubt, update to your latest release prior to installation of the new CPU.
Just like the Ryzen 3000-series before it, Ryzen 5000-series CPUs will be compatible with the prior motherboard generation… eventually. 400-series BIOS updates are in development now and beta releases should be available in January 2021 across a wide range of both B450 and X470 models; early adopters will therefore need to leverage a 500-series board.
No changes to upper TDP limits and stock memory support means there shouldn’t be any new issues with specific CPU/Motherboard combinations due to weak power delivery systems at stock speeds. In-situ processor updates therefore could be made more affordable than a typical whole-system upgrade.
CHIPLETS RETURN
Ryzen 5000-series CPUs inherit many of the physical characteristics from the 3000-series. As well as an AM4-compatible interposer, each processor features one or two 7nm Core Complex Dies (CCD) and a single 12nm IO Die (IOD). The IOD is unchanged from the 3000-series, whereas the CCD has undergone significant updates.Ryzen 5000-series processor with IOD and single CCD chiplets
As with the previous generation, Chiplets allow AMD to aggressively bin their dies and allocate the best performing ones accordingly. It’s for that reason that clock speeds increase as we go up the range, and only the 105W power envelope of the dual-CCD 5950X appears to restrict its base clock.
Test Setup & Testing
For the purpose of testing the Ryzen 5 5600G we used the AORUS X570 MASTER since it is placed as a high-end motherboard, this should give us the capabilities of showing the true potential of this chip.
CPU being tested
AMD Ryzen 5 5600GTEST SETUP
Cooling Corsair Hydro Series H110iMotherboard AORUS X570 Master
Memory 32GB Corsair Vengeance LPX 3000MHz
Graphics Radeon RX 480 8GB
Storage Intel S3500 128GB
PSU Corsair RM 1000 80 Plus Gold Certified PSU
Monitor AOC U2879VF
BENCHMARKS
Cinebench R15/R20 – CPU/OpenGL Scorex264 HD 4.0 – 1st and 2nd pass encoding
SiSoftware SANDRA – CPU & Memory benchmarks
POV-RAY – CPU benchmarks
TrueCrypt – CPU benchmarks
AIDA64 – CPU benchmarks & Memory
PCMark 8 – Home Suite & Photoshop
3DMark FireStrike – 3D Benchmark
Games – Rise of the Tomb Raider & Total War: WARHAMMER
OTHER SOFTWARE
Temperature Analysis: CoreTempStress Testing Software: AIDA64 Stability Test
CPU Specification Monitoring: CPU-Z
Temperatures & Overclocking
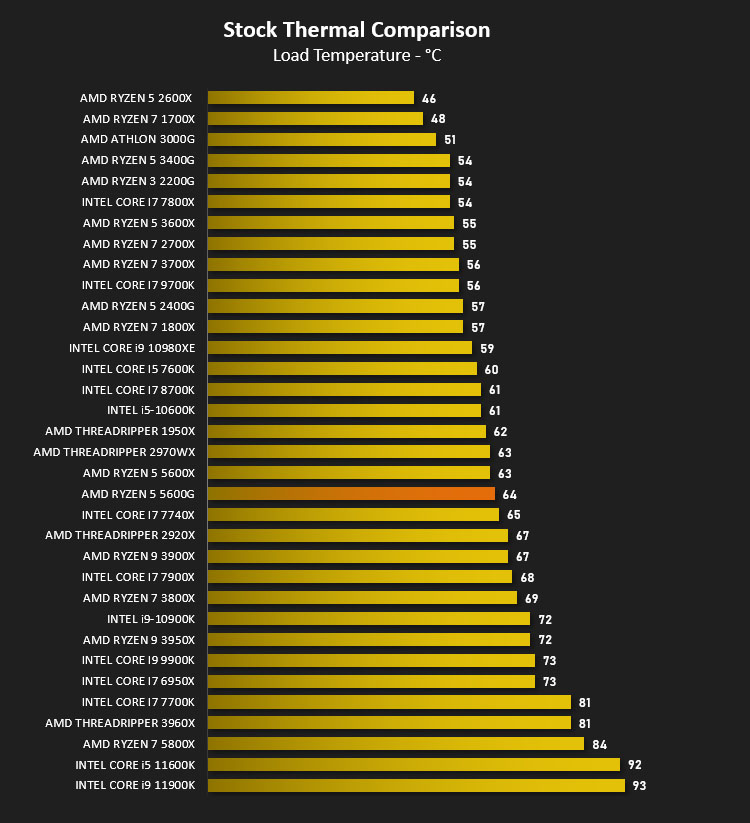
Below are the temperatures for each of the CPUs – without any overclock applied. We’ve also compared to previously released AMD and Intel counterparts (which we’ve also benchmarked against on the subsequent pages too):
OVERCLOCKING
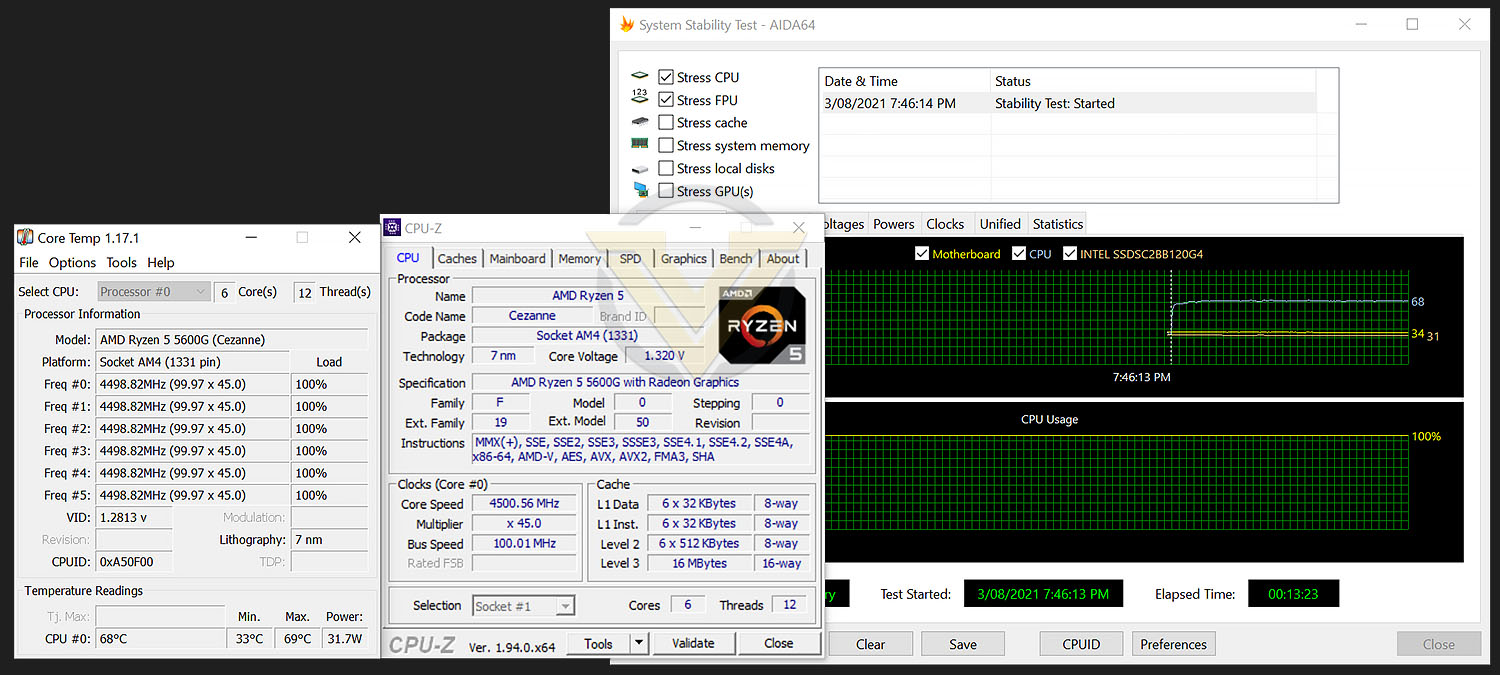
Moving to the overclocking phase of our review, the goal is to see how far we can push the processor over it’s stock/reference settings. The 5600G has a turbo boost of 4.4GHz.We quickly established that there wasn’t a great deal of headroom with this chip and our best efforts allowed us to hit 4.5GHz at 1.31v.
Power Consumption
It’s interesting to note the power consumption across all processors. Although they are using a combination of different motherboard chipsets, energy results can fluctuate between manufacturers due to the features and specifications that are integrated. First of all, for the idle tests the system is cold booted into Windows and no additional applications are executed – the watts are noted on the external energy monitor we use and then the system is loaded with 3DMark FireStrike – watts are again monitored for the duration of the test and the highest rated wattage result is then noted down. Below are the results of this energy test.
Ray Tracing Performance – POV-Ray 3.7
Persistence of Vision Raytracer’s PovRay is a free and open source 3D animator application with versions for computers with different operating systems.
This product allows users to build their custom 3D worlds with excellent quality despite their computer’s hardware. It has adjustable options for levels of radiance, refraction, and reflection. Calculation time may vary depending on the computer model, but PovRay can adapt to many computer builds, and is supported by the open source community.
This product allows users to build their custom 3D worlds with excellent quality despite their computer’s hardware. It has adjustable options for levels of radiance, refraction, and reflection. Calculation time may vary depending on the computer model, but PovRay can adapt to many computer builds, and is supported by the open source community.
AES Encryption Performance – TrueCrypt 7.1a
TrueCrypt is a discontinued source-available freeware utility used for on-the-fly encryption (OTFE). It can create a virtual encrypted disk within a file or encrypt a partition or (under Microsoft Windows except Windows 8 with GPT) the entire storage device (pre-boot authentication).
Encoding Performance – X264 HD
Simply put, this test measures how fast your machine can encode a short, DVD quality MPEG-2 video clip into a high-quality x264 video clip. What’s x264, you ask? It’s more or less the next-generation Xvid/DivX codec. I think it’s ideal for a benchmark because the application (x264.exe) reports fairly accurate compression results (in frames per second) for each pass of the video encoding process, and it uses multi-core processors very efficiently.
x264 HD gives results for 2 passes when compressing an MPEG-2 clip into x264. It presents 4 separate results for each pass giving a total of 8 – all results are given in FPS. For each pass I have averaged out the results.
Processing Features Performance – AIDA64
AIDA64 Product Page
This simple integer benchmark focuses on the branch prediction capabilities and the misprediction penalties of the CPU. It finds the solutions for the classic “Queens problem” on a 10 by 10 sized chessboard. At the same clock speed theoretically the processor with the shorter pipeline and smaller misprediction penalties will attain higher benchmark scores. For example — with HyperThreading disabled — the Intel Northwood core processors get higher scores than the Intel Prescott core based ones due to the 20-step vs 31-step long pipeline. CPU Queen test uses integer MMX, SSE2 and SSSE3 optimizations.
Memory Transfer Performance – AIDA64
AIDA64 Product Page
This simple integer benchmark focuses on the branch prediction capabilities and the misprediction penalties of the CPU. It finds the solutions for the classic “Queens problem” on a 10 by 10 sized chessboard. At the same clock speed theoretically the processor with the shorter pipeline and smaller misprediction penalties will attain higher benchmark scores. For example — with HyperThreading disabled — the Intel Northwood core processors get higher scores than the Intel Prescott core based ones due to the 20-step vs 31-step long pipeline. CPU Queen test uses integer MMX, SSE2 and SSSE3 optimizations.
Processing Power Performance – Cinebench R15 & R20
CINEBENCH can measure systems with up to 64 processor threads. This test scene contains approximately 2,000 objects which in turn contain more than 300,000 polygons in total, and uses sharp and blurred reflections, area lights, shadows, procedural shaders, antialiasing, and much more. The result is displayed in points (pts). The higher the number, the faster your processor.
Bandwidth Performance – SiSoftware SANDRA
3DMark 11 Product Page
SANDRA isn’t always a benchmark that is included in hardware reviews but I believe it shouldn’t be ignored. SANDRA provides a vigorous package that tests your system in a rather large array of benchmarks. There are many aspects of benchmark that can be executed. We will be considering – CPU and memory tests.
Image Editing Performance – PCMark 8 Photoshop
PCMark 8 Product Page Developed in partnership with Benchmark Development Program members Acer, AMD, Condusiv Technologies, Dell, HGST, HP, Intel, Microsoft, NVIDIA, Samsung, SanDisk, Seagate and Western Digital, PCMark 8 is the latest version in FutureMark’s popular series of PC benchmarking tools. Improving on previous releases, PCMark 8 includes new tests using popular applications from Adobe and Microsoft.
Overall System Performance – PCMark 10
PCMark 10 Product Page
Developed in partnership with Benchmark Development Program members Acer, AMD, Condusiv Technologies, Dell, HGST, HP, Intel, Microsoft, NVIDIA, Samsung, SanDisk, Seagate and Western Digital, PCMark 10 is the latest version in FutureMark’s popular series of PC benchmarking tools. Improving on previous releases, PCMark 10 includes new tests using popular applications from Adobe and Microsoft.
VR Performance – VRMark
VRMark Product PageVRMark includes two VR benchmark tests that run on your monitor, no headset required, or on a connected HMD. At the end of each test, you’ll see whether your PC is VR ready, and if not, how far it falls short.
Gaming Performance – Tomb Raider & Total War: WARHAMMER
It’s important for us to perform a number of game benchmarks as well as the synthetic tests because gamers will want to know if there are any significant benefits. So here we have two recent gaming titles benchmarked with a Radeon RX 480 installed.
Conclusion
By firstly coming to OEM and prebuilt systems, this highlights what class of product is before is in the Ryzen 5000G Series. We wouldn’t go as far as deeming it is lack-lustre but we’d term this as a horizontal launch. The G Series brings nothing spectacularly new (aside from integrated graphics, but even this is still Vega-based), since AMD are filling the gaps and arming the Ryzen 5000 series family with even more options – solidifying the range.
The 5600G we’ve been checking out today therefore comes with no huge surprises. It is in fact very similar to its 5600X counterpart. A 200MHz clock speed differential, lack of PCIe 4.0 support and inclusion of integrated graphics are just a small handful of the changes.
When placing the 5600G into our benchmark suite, you won’t be shocked to see marginal variances in performance between the 5600G and 5600X. The 6 core, 12 thread attributes, similar clock speeds and cache determine these results. Up against the likes of the Intel Core i5-11600K, the 5600G is an excellent contender in a range of scenarios. So, the 5600G is a solid mid-range performer with the added bonus of integrated graphics – which actually may come in handy in this season of abysmal GPU availability. (Some enthusiasts are GPU-less, waiting to snatch a graphics card when they become available).
Choosing the G Series will prevent PCIe 4.0 functionality on motherboards which feature the X570 chipset and while this may not be a big deal for graphics card usage, it affects storage more so. Users will lose out on the super-fast performance gains that PCIe 4.0 offers, and we’re seeing more and more M.2 SSDs being released which use this interface.
AMD’s Ryzen 5 5600G is priced at $259 USD / $399 AUD. This makes for an attractive buy to those requiring a mid-range processor on AMD’s popular Ryzen/X570 platform who need integrated graphics.
The Ryzen 5 5600G is a compelling option for system builders who seek to get the mid-range best bang for buck.
Pros
+ Low power consumption
+ Generates very little heat
+ Great single/multi-core performance
+ Includes integrated graphics
+ Reasonably priced
Cons
– Lacks PCIe 4.0 support
– Doesn’t overclock well
+ Low power consumption
+ Generates very little heat
+ Great single/multi-core performance
+ Includes integrated graphics
+ Reasonably priced
Cons
– Lacks PCIe 4.0 support
– Doesn’t overclock well
Click here for an explanation of our awards at Vortez.net.
Stay connected with the Vortez Social Media pages:
Join in with the discussions on Discord