



We take a look at Kingston’s latest and greatest M.2 NVMe SSD – KC2500 is marked out as the companies fastest Solid State Drive, but how does it compare to the competition?

Product on Review: KC2500 SSD
Manufacturer: Kingston
Street Price: 1TB Model – £172 GBP | $235 USD | $289 AUD
Although PCIe 4.0 SSDs are beginning to flood the storage market, there is still plenty of life left in the PCIe 3.0 x4 department. In fact, just in the last month or two we’ve seen various brands release new models using this interface because let’s face it – the performance on offer is still exceptional and not all platforms have embraced PCIe 4.0.
Kingston are no strangers to the storage battleground, they’ve been a key player since 1987 and today we’re poised to take a detailed look at their very latest KC2500 – boasting up to 3500MB/s sequential transfer rates and 375K IOPS.
Pricing on the KC2500 is extremely competitive and there is a lengthy 5 year warranty on offer with every purchase. Is this drive worth adding to your configuration? Let’s find out!
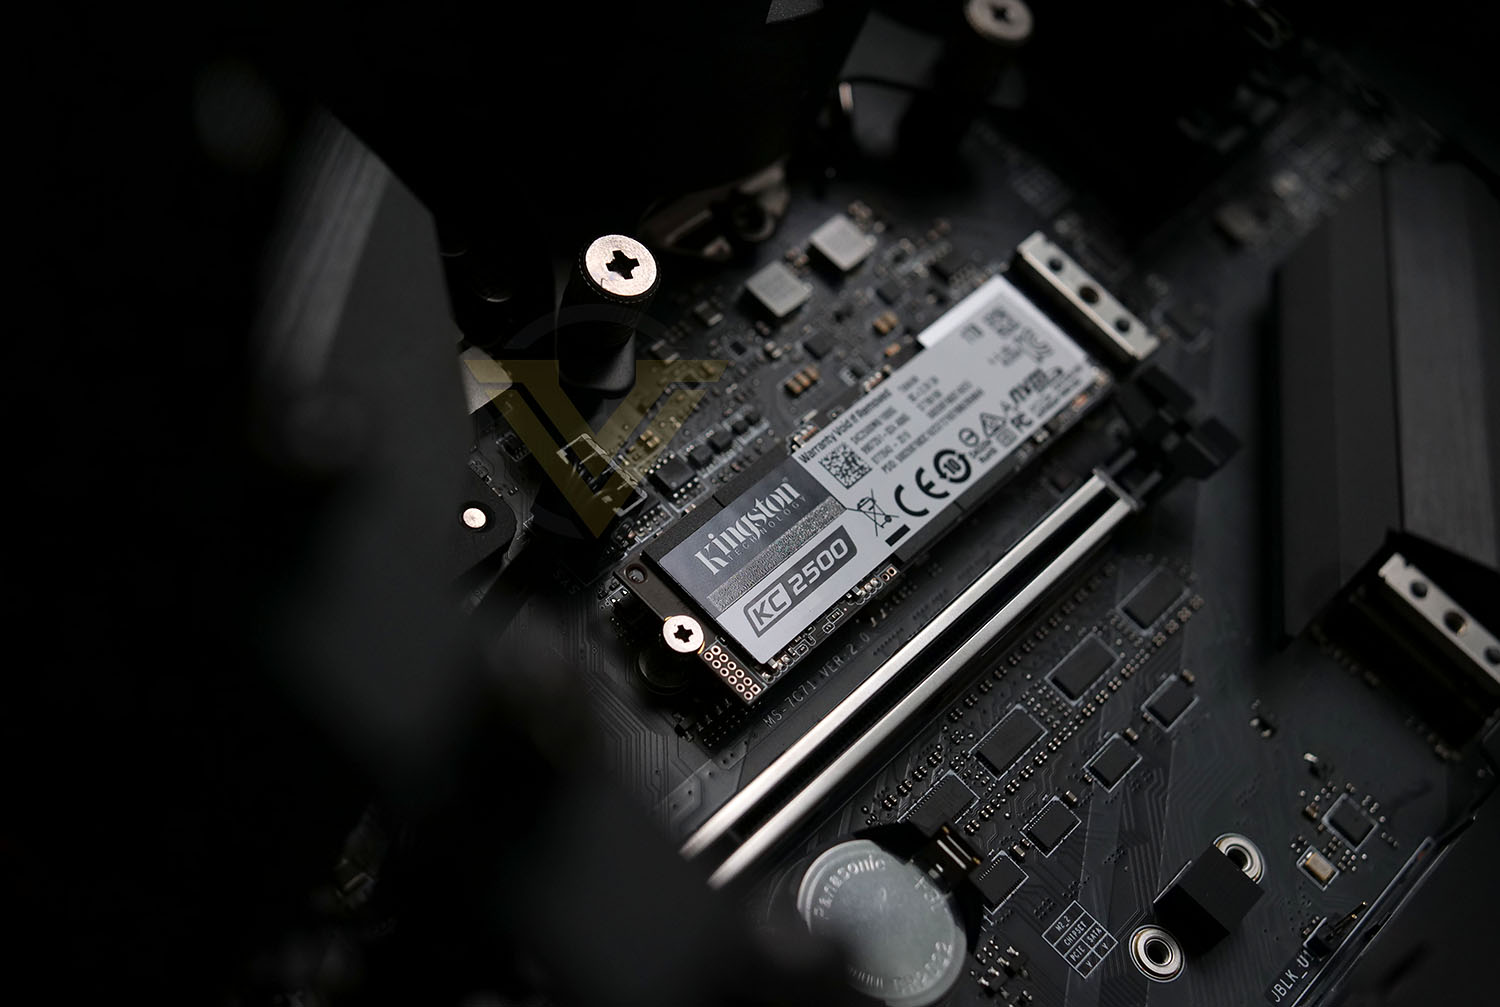
Kingston on their KC2500
Kingston’s KC2500 NVMe PCIe SSD delivers powerful performance using the latest Gen 3.0 x 4 controller and 96-layer 3D TLC NAND. With read/write speeds up to 3,500/2,900MB/s1, KC2500 delivers outstanding endurance and improves the workflow in desktop, workstations, and high-performance computing (HPC) systems. The compact M.2 design gives greater flexibility, increasing storage but also saving space.
Technical Specifications
Below are the technical specifications surrounding the KC2500:
Capacity
250GB, 500GB, 1TB, 2TB
Form Factor
M.2 2280
Interface
PCIe Gen3x4
Speed
Sequential Read/Write1 250GB – up to 3,500/1,200MB/s
500GB – up to 3,500/2,500MB/s
1TB – up to 3,500/2,900MB/s
2TB – up to 3,500/2,900MB/s
Random 4K Read/Write1 250GB – up to 375,000/300,000 IOPS
500GB – up to 375,000/300,000 IOPS
1TB – up to 375,000/300,000 IOPS
2TB – up to 375,000/300,000 IOPS
NAND flash
96-Layer 3D TLC
Controller
SMI 2262EN
Operating Temperature
0° to 70° C
Storage Temperature
-40° C to 85° C
TBW
250GB – 150TBW
500GB – 300TBW
1TB – 600TBW
2TB – 1.2PBW
MTBF
2,000,000 Hours
Dimension (L x W x H)
80mm x 22mm x 3.5mm
Weight
8-11g
250GB, 500GB, 1TB, 2TB
Form Factor
M.2 2280
Interface
PCIe Gen3x4
Speed
Sequential Read/Write1 250GB – up to 3,500/1,200MB/s
500GB – up to 3,500/2,500MB/s
1TB – up to 3,500/2,900MB/s
2TB – up to 3,500/2,900MB/s
Random 4K Read/Write1 250GB – up to 375,000/300,000 IOPS
500GB – up to 375,000/300,000 IOPS
1TB – up to 375,000/300,000 IOPS
2TB – up to 375,000/300,000 IOPS
NAND flash
96-Layer 3D TLC
Controller
SMI 2262EN
Operating Temperature
0° to 70° C
Storage Temperature
-40° C to 85° C
TBW
250GB – 150TBW
500GB – 300TBW
1TB – 600TBW
2TB – 1.2PBW
MTBF
2,000,000 Hours
Dimension (L x W x H)
80mm x 22mm x 3.5mm
Weight
8-11g
Closer Look
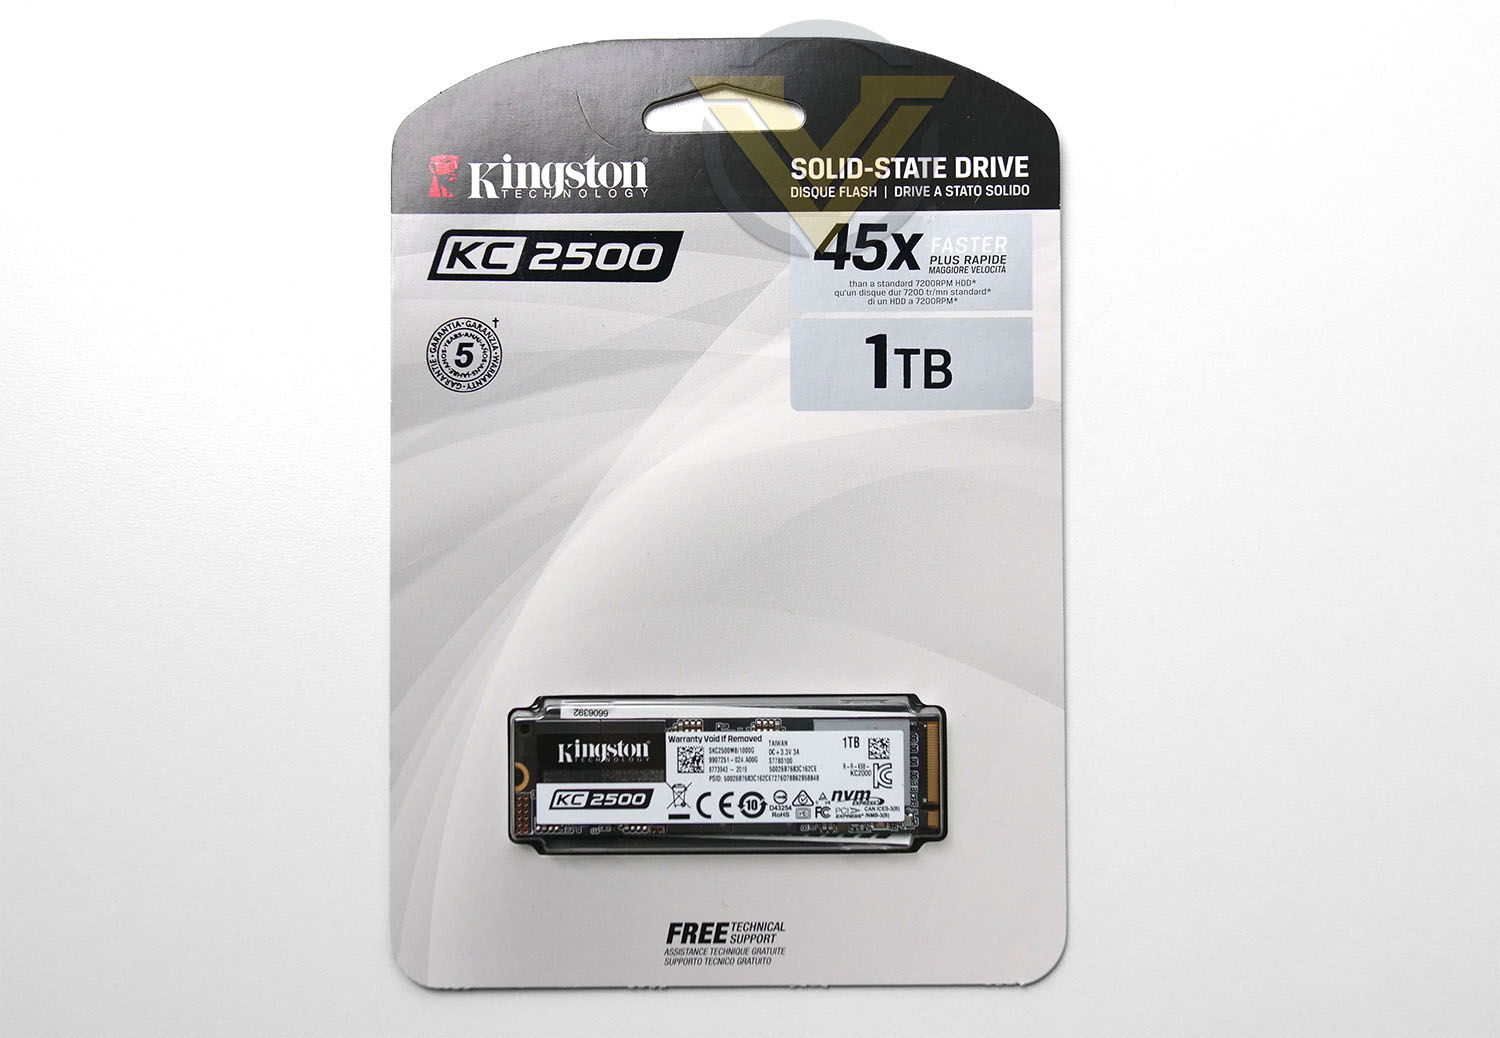
Kingston has decided to go for the minimalist approach with packaging on the KC2500, which is a great idea since this can be easily recycled once the drive is removed. As you can see there is very little by way of information, aside from some stats surrounding the speed, capacity and warranty. To extract the drive from the packet, we just need to slice the back. The drive comes on its own with a plastic container.
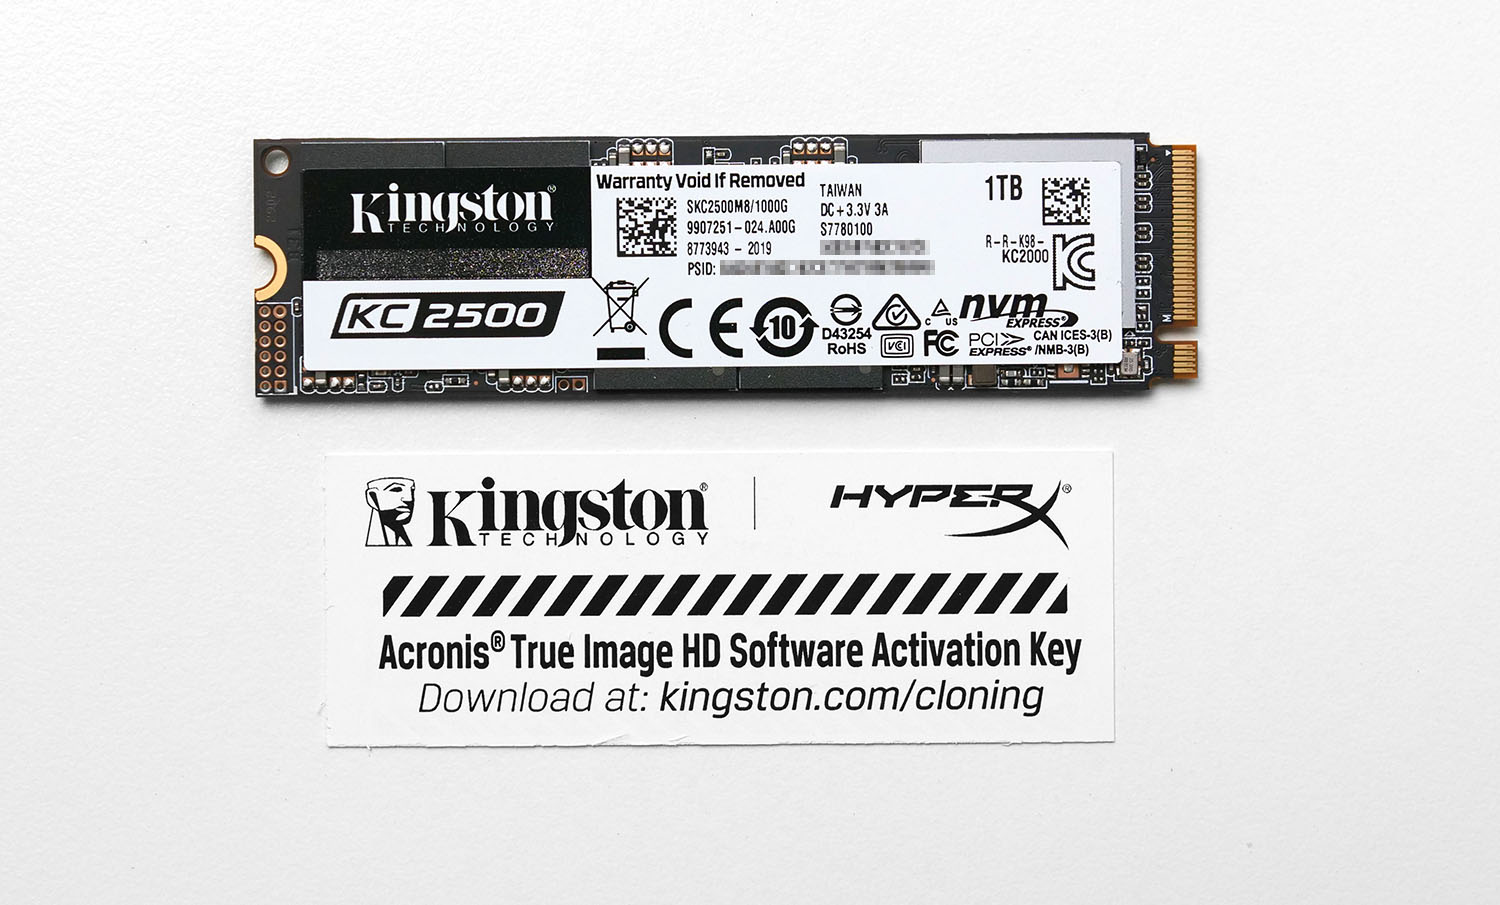
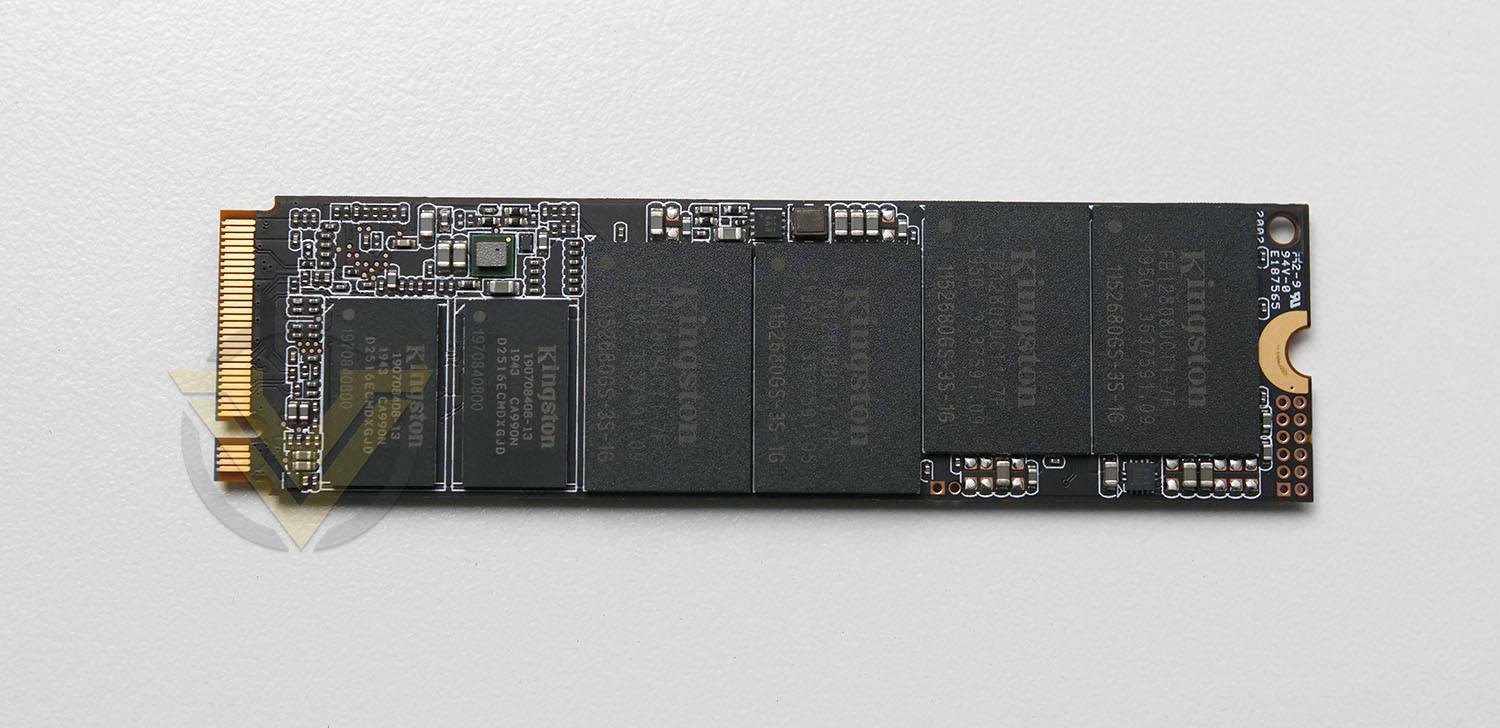
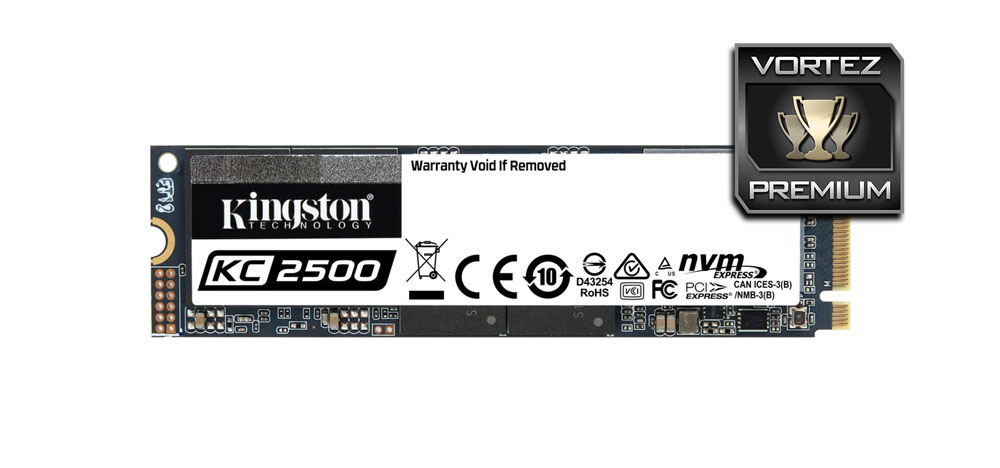
KC2500 conforms to the M.2 form factor and more specifically the 2280 size. Kingston has gone with a simple aesthetic on this SSD the specifications label will obviously be the most visible element if you don’t have a motherboard heatsink clamped to the top of the drive. While it isn’t garish, it still draws attention which may be a good or bad thing. Along with the drive, users are treated to a license of Acronis True Image HD – the key is on the reverse.
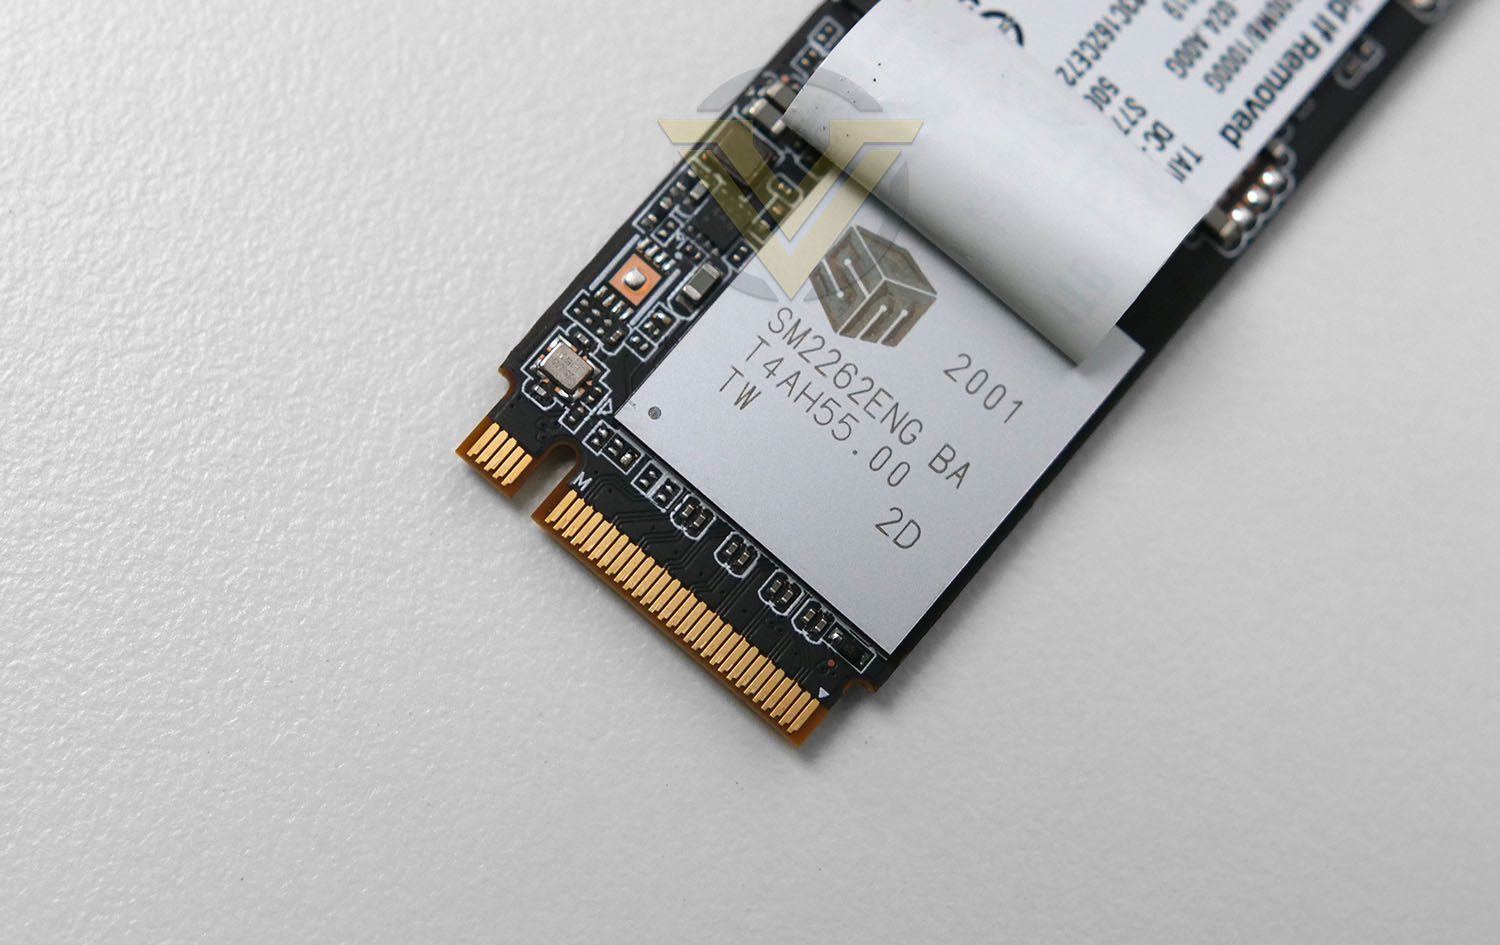
This particular M.2 drive is based on the SMI 2262EN NVMe controller which offers eight-channels and against the rival Phison E12 controller it offers lower IOPS at up to 420K but excels in sequential read/write performance – reaching 3500MB/s.
Over the next pages we’ll be putting the KC2500 under examination to see what you can expect in terms of performance.
Test Setup & Methodology
Our test system is formatted and a fresh version of Windows is installed with just drives in place – no additional applications. Windows is then updated to the latest release and the drivers are installed.
Included in the list of benchmarks are the following applications:
BENCHMARKS
Anvil Pro
AS SSD
ATTO Disk Benchmark v2.46
Futuremark PCMark 8
AIDA64
AS SSD
ATTO Disk Benchmark v2.46
Futuremark PCMark 8
AIDA64
TEST CONFIG
CPU Intel Core i9-10900K
Motherboard MSI Z490 UNIFY
Graphics MSI RX 5700 XT GAMING X
Memory 32GB Corsair Vengeance LPX 3200MHz DDR4
Storage Kingston KC2500
PSU Corsair HX1050 Gold
OS Microsoft Windows 10 Professional 64-Bit
Motherboard MSI Z490 UNIFY
Graphics MSI RX 5700 XT GAMING X
Memory 32GB Corsair Vengeance LPX 3200MHz DDR4
Storage Kingston KC2500
PSU Corsair HX1050 Gold
OS Microsoft Windows 10 Professional 64-Bit
Benchmarks: Anvil Pro
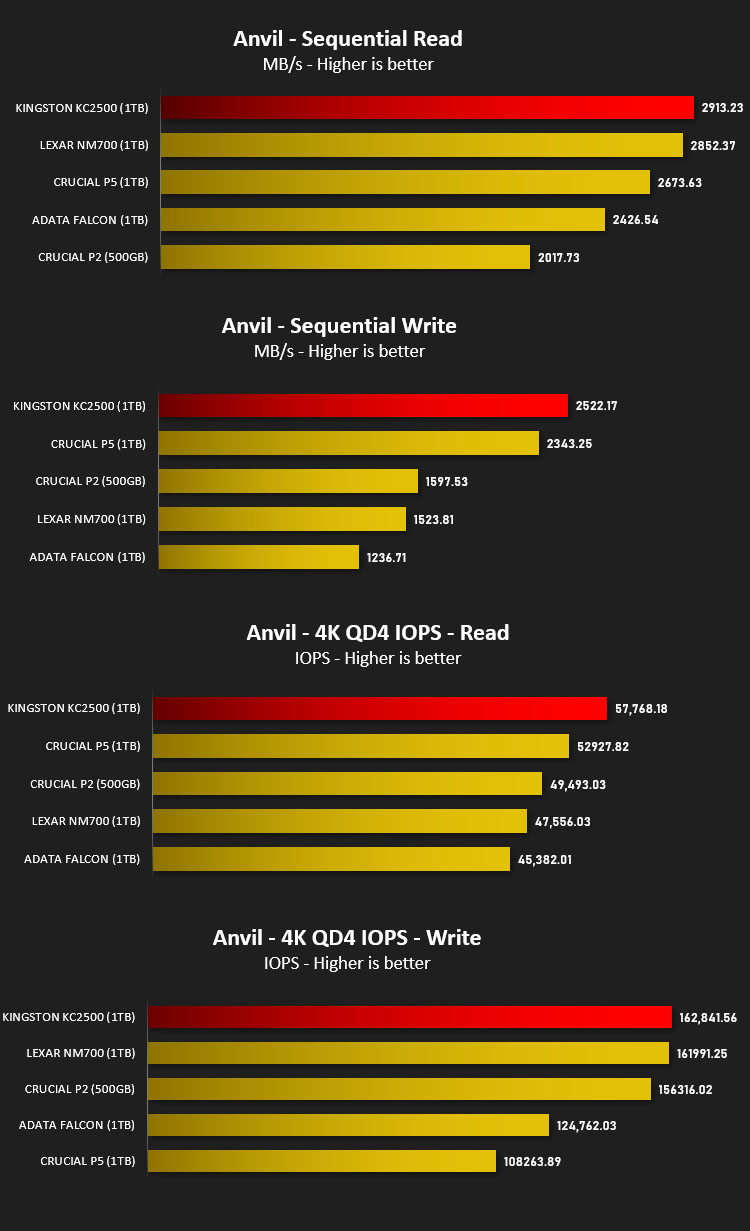
Anvil Pro from Anvil Storage utilities is one of the most popular storage benchmarking utilities today thanks to the large suit of tests available. You can test pretty much anything from Read/write Speed to IOPs with many variables to tweak allowing you to get either a single or host of results to compare with other likeminded enthusiasts. In our test we ran the standard suite 5 times, subtracting both the highest and lowest scores and determined the final result from the average of the remaining three results.
Benchmarks: AS SSD
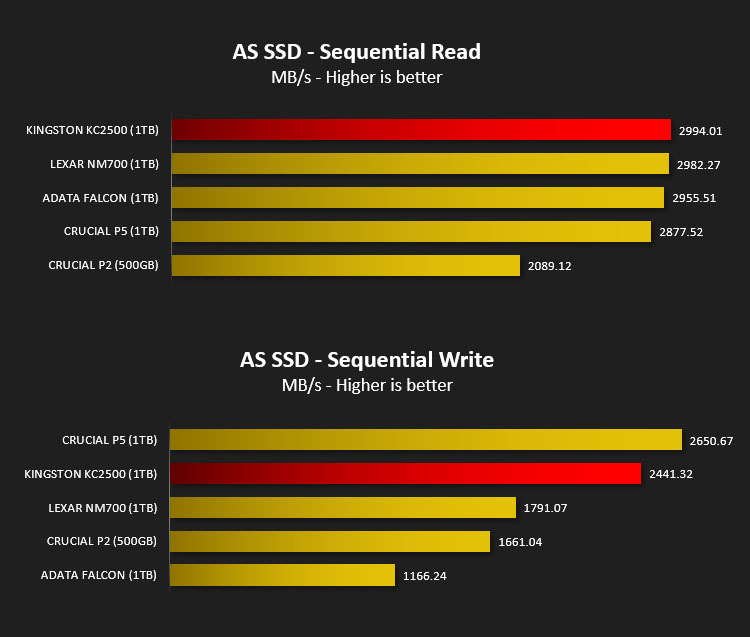
AS SSD Benchmark is a straightforward tool for measuring the speed of your SSD drive.
Simply launch the program, choose your drive, click Start, and it’ll test your SSD’s read and write speed in a variety of ways, delivering a score for each when it’s done. And if that’s not enough, there are also additional file copy and compression-related benchmarks available from the Tools menu. (The author’s support page is German only, but if you need further English explanations then there’s a thread on the program at the OCZ Technology forum.).
Simply launch the program, choose your drive, click Start, and it’ll test your SSD’s read and write speed in a variety of ways, delivering a score for each when it’s done. And if that’s not enough, there are also additional file copy and compression-related benchmarks available from the Tools menu. (The author’s support page is German only, but if you need further English explanations then there’s a thread on the program at the OCZ Technology forum.).
Benchmarks: ATTO
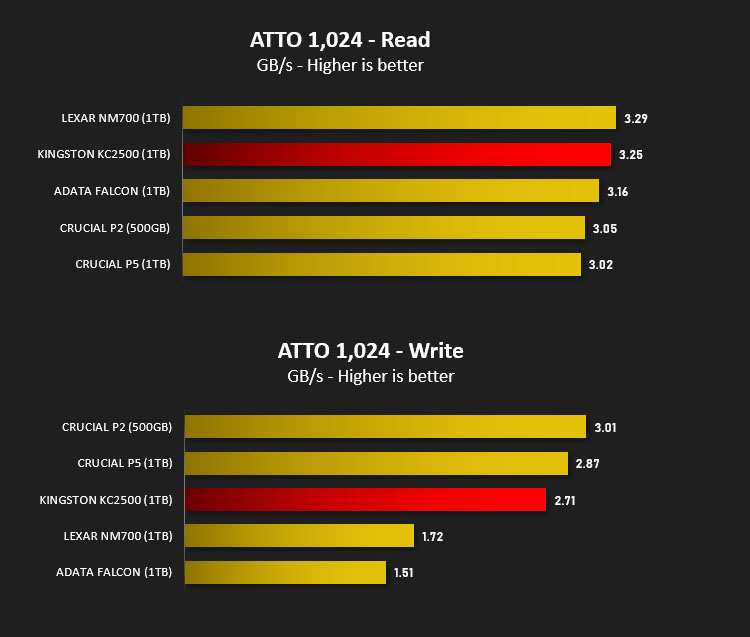
The ATTO Disk Benchmark performance measurement tool is compatible with Microsoft Windows. Measure your storage systems performance with various transfer sizes and test lengths for reads and writes. Several options are available to customize your performance measurement including queue depth, overlapped I/O and even a comparison mode with the option to run continuously. Use ATTO Disk Benchmark to test any manufacturers RAID controllers, storage controllers, host adapters, hard drives and SSD drives and notice that ATTO products will consistently provide the highest level of performance to your storage.
Benchmarks: AIDA64
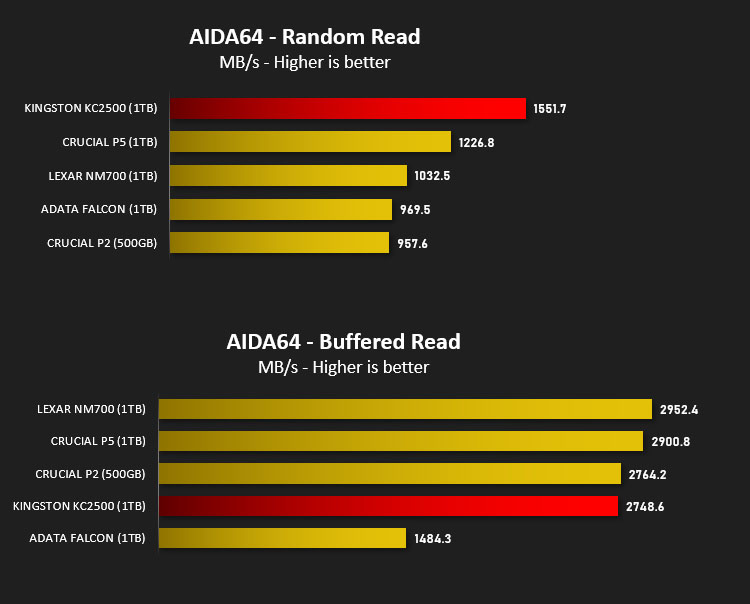
AIDA64 Product PageThis simple integer benchmark focuses on the branch prediction capabilities and the misprediction penalties of the CPU. It finds the solutions for the classic “Queens problem” on a 10 by 10 sized chessboard. At the same clock speed theoretically the processor with the shorter pipeline and smaller misprediction penalties will attain higher benchmark scores. For example — with HyperThreading disabled — the Intel Northwood core processors get higher scores than the Intel Prescott core based ones due to the 20-step vs 31-step long pipeline. CPU Queen test uses integer MMX, SSE2 and SSSE3 optimizations.
Benchmarks: CrystalDiskMark
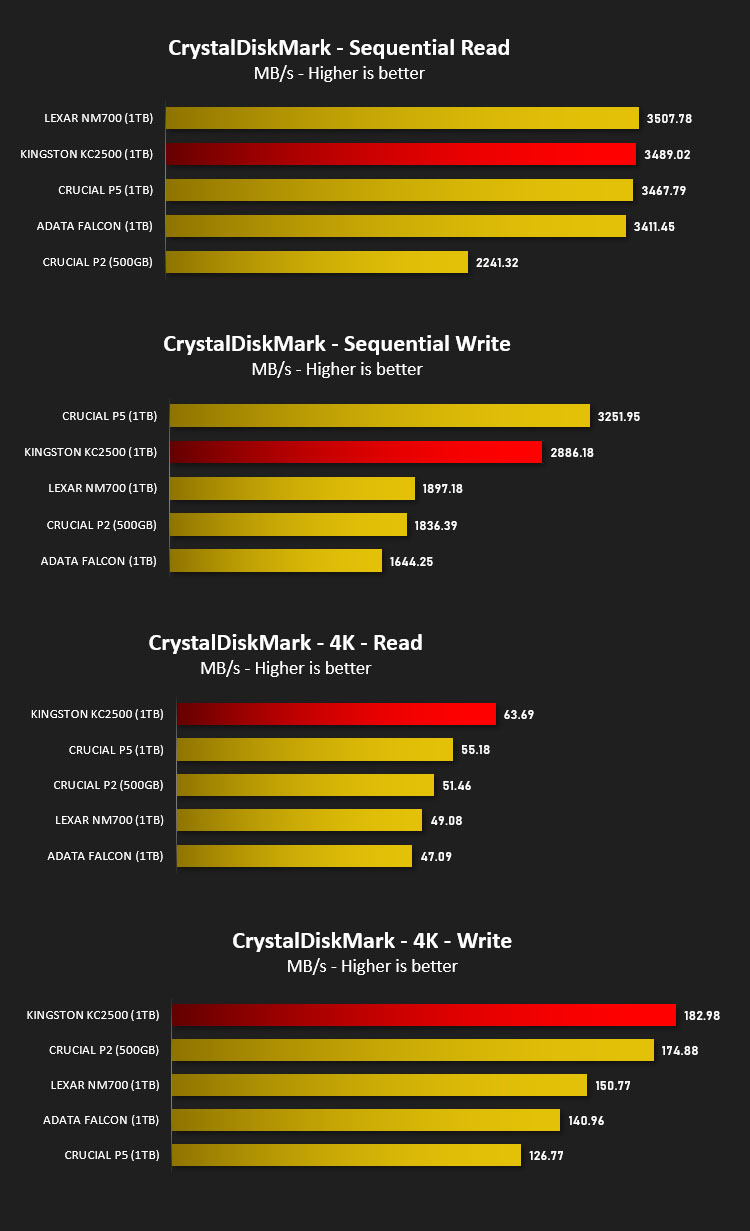
CrystalDiskMark is an open source disk drive benchmark tool for Microsoft Windows. Based on Microsoft’s MIT-licensed Diskspd tool, this graphical benchmark is commonly used for testing the performance of solid-state storage. It works by reading and writing through the filesystem in a volume-dependent way. It generates read/write speeds in sequential and random positions with varying numbers of queues and threads.
Conclusion
If you’ve just come from the preceding pages you’ll be left in no doubt of the KC2500’s capabilities. This SSD takes performance into the upper echelons of the interface and in most of our tests came out as the victor.
In some of the read/write benchmarks we found the KC2500 fall behind some of the previously reviewed SSDs but in reality, most applications won’t be able to utilise such throughput. Instead, emphasis is placed more highly on stronger IOPS – along with great IOPS, the drive can handle input/output requests, data queuing and concurrent access much more efficiently. Thankfully, Kingston’s drive excels in this area and came out on top for IOPS performance.
KC2500 is available to buy in a variety of capacities from 250GB to 2TB. Our 1TB model is priced at 1TB Model – £172 GBP | $235 USD | $289 AUD. In some cases this means the KC2500 is a better value for money option and certainly when you weigh up the performance gains it totally makes sense to opt for Kingston’s offering if you are also seeking outright performance. This drive is also backed by a lengthy 5-year warranty which is considerably more generous than we’ve encountered for a storage drive.
Excellent performance and attractive pricing makes the KC2500 the obvious choice if you’re on the hunt for a new M.2 SSD!
Pros
+ Excellent overall performance
+ Clean styling
+ Reasonably priced
+ 5 Years Warranty
Cons
– None apparent
+ Excellent overall performance
+ Clean styling
+ Reasonably priced
+ 5 Years Warranty
Cons
– None apparent
Click here for an explanation of our awards at Vortez.net.
Stay connected with the Vortez Social Media pages: